There are both natural and human sources of carbon dioxide emissions. Natural sources include decomposition, ocean release and respiration. Human sources come from activities like cement production, deforestation as well as the burning of fossil fuels like coal, oil and natural gas.
Due to human activities, the atmospheric concentration of carbon dioxide has been rising extensively since the Industrial Revolution and has now reached dangerous levels not seen in the last 3 million years. Human sources of carbon dioxide emissions are much smaller than natural emissions but they have upset the natural balance that existed for many thousands of years before the influence of humans.
This is because natural sinks remove around the same quantity of carbon dioxide from the atmosphere than are produced by natural sources. This had kept carbon dioxide levels balanced and in a safe range. But human sources of emissions have upset the natural balance by adding extra carbon dioxide to the atmosphere without removing any.
Carbon Dioxide Emissions: Human Sources
Since the Industrial Revolution, human sources of carbon dioxide emissions have been growing. Human activities such as the burning of oil, coal and gas, as well as deforestation are the primary cause of the increased carbon dioxide concentrations in the atmosphere.
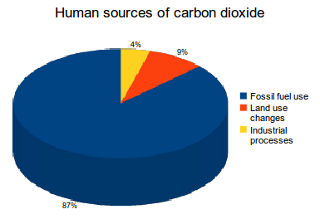
87 percent of all human-produced carbon dioxide emissions come from the burning of fossil fuels like coal, natural gas and oil. The remainder results from the clearing of forests and other land use changes (9%), as well as some industrial processes such as cement manufacturing (4%).
Figure 1: Source: Le Quéré, C. et al. (2013). The global carbon budget 1959-2011.
Fossil fuel combustion/use
The largest human source of carbon dioxide emissions is from the combustion of fossil fuels. This produces 87% of human carbon dioxide emissions. Burning these fuels releases energy which is most commonly turned into heat, electricity or power for transportation. Some examples of where they are used are in power plants, cars, planes and industrial facilities. In 2011, fossil fuel use created 33.2 billion tonnes of carbon dioxide emissions worldwide.
The 3 types of fossil fuels that are used the most are coal, natural gas and oil. Coal is responsible for 43% of carbon dioxide emissions from fuel combustion, 36% is produced by oil and 20% from natural gas.
Coal is the most carbon intensive fossil fuel. For every tonne of coal burned, approximately 2.5 tonnes of CO2e are produced. Of all the different types of fossil fuels, coal produces the most carbon dioxide. Because of this and it's high rate of use, coal is the largest fossil fuel source of carbon dioxide emissions. Coal represents one-third of fossil fuels' share of world total primary energy supply but is responsible for 43% of carbon dioxide emissions from fossil fuel use.
Anything involving fossil fuels has a carbon dioxide emission ticket attached. So for example, burning these fuels releases energy but carbon dioxide also gets produced as a byproduct. This is because almost all the carbon that is stored in fossil fuels gets transformed to carbon dioxide during this process.
The three main economic sectors that use fossil fuels are: electricity/heat, transportation and industry. The first two sectors, electricity/heat and transportation, produced nearly two-thirds of global carbon dioxide emissions in 2010.
Electricity/Heat sector
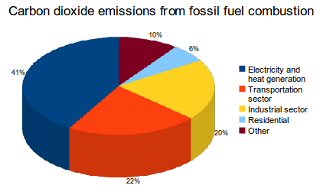
Electricity and heat generation is the economic sector that produces the largest amount of man-made carbon dioxide emissions. This sector produced 41% of fossil fuel related carbon dioxide emissions in 2010. Around the world, this sector relies heavily on coal, the most carbon-intensive of fossil fuels, explaining this sector giant carbon footprint.
Almost all industrialized nations get the majority of their electricity from the combustion of fossil fuels (around 60-90%). Only Canada and France are the exception. Depending on the energy mix of your local power company you probably will find that the electricity that you use at home and at work has a considerable impact on greenhouse gas emissions.
Below is a chart for percentage of electrical energy produced by fossil fuel combustion for major industrialized nations, for the complete list of all nations click here.
Table 1:
| Electrical Energy Produced By Fossil Fuel Combustion |
| (Billion Kilowatthours) | | | |
| G8 Nation | Fossil Fuel Combustion | Total | % |
| Canada | 136.31 | 622.98 | 21.9% |
| France | 44.65 | 532.57 | 8.4% |
| Germany | 340.38 | 567.33 | 60.0% |
| Italy | 286.35 | 201.7 | 70.4% |
| Japan | 759.93 | 1031.22 | 73.7% |
| Russia | 668.26 | 996.82 | 67.0% |
| United Kingdom | 244.5 | 342.48 | 71.4% |
| United States | 2,788.87 | 4,100.14 | 68.0% |
Source: International Energy Statistics Database (2011), Energy Information Administration
The industrial, residential and commercial sectors are the main users of electricity covering 92% of usage. Industry is the largest consumer of the three because certain manufacturing processes are very energy intensive. Specifically, the production of chemicals, iron/steel, cement, aluminum as well as pulp and paper account for the great majority of industrial electricity use. The residential and commercial sectors are also heavily reliant on electricity for meeting their energy needs, particularly for lighting, heating, air conditioning and appliances.
Transportation sector
The transportation sector is the second largest source of anthropogenic carbon dioxide emissions. Transporting goods and people around the world produced 22% of fossil fuel related carbon dioxide emissions in 2010. This sector is very energy intensive and it uses petroleum based fuels (gasoline, diesel, kerosene, etc.) almost exclusively to meet those needs. Since the 1990s, transport related emissions have grown rapidly, increasing by 45% in less than 2 decades.
Road transport accounts for 72% of this sector's carbon dioxide emissions. Automobiles, freight and light-duty trucks are the main sources of emissions for the whole transport sector and emissions from these three have steadily grown since 1990. Apart from road vehicles, the other important sources of emissions for this sector are marine shipping and global aviation.
Marine shipping produces 14% of all transport carbon dioxide emissions. While there are a lot less ships than road vehicles used in the transportation sector, ships burn the dirtiest fuel on the market, a fuel that is so unrefined that it can be solid enough to be walked across at room temperature. Because of this, marine shipping is responsible for over 1 billion tonnes of carbon dioxide emissions. This is more than the annual emissions of several industrialized countries (Germany, South Korea, Canada, UK, etc.) and this sector continues to grow rapidly.
Global aviation accounts for 11% of all transport carbon dioxide emissions. International flights create about 62% of these emissions with domestic flights representing the remaining 38%. Over the last 10 years, aviation has been one of the fastest growing sources of carbon dioxide emissions. Aviation is also the most carbon-intensive form of transportation, so it's growth comes with a heavy impact on climate change.
Figure 2: Source: CO2 Emissions from Fuel Combustion (2012), International Energy Agency.
Figure 2 highlights one of the most alarming trends in today's modern economy. Emissions caused by the transportation of people and goods has grown so rapidly that it has surpassed emissions from the industrial sector, which has had a huge impact on climate change. This trend started in the 1990's and has continued ever since causing an increase in indirect emissions.
The emissions caused by the transportation of goods are examples of indirect emissions since the consumer has no direct control of the distance between the factory and the store. The emissions caused by people traveling (by car, plane, train, etc...) are examples of direct emissions since people can chose where they are going and by what method.
Since the distance traveled by goods during production is continuing to grow, this is putting more pressure on the transportation industry to bridge the gap and ends up creating more indirect emissions. What's worse is that 99% of the carbon dioxide emissions caused by transportation of people and goods all over the world comes from the combustion of fossil fuels.
Industrial sector
The industrial sector is the third largest source of man-made carbon dioxide emissions. This sector produced 20% of fossil fuel related carbon dioxide emissions in 2010. The industrial sector consists of manufacturing, construction, mining, and agriculture. Manufacturing is the largest of the 4 and can be broken down into 5 main categories: paper, food, petroleum refineries, chemicals, and metal/mineral products. These categories account for the vast majority of the fossil fuel use and CO2 emissions by this sector.
Manufacturing and industrial processes all combine to produce large amounts of each type of greenhouse gas but specifically large amounts of CO2. This is because many manufacturing facilities directly use fossil fuels to create heat and steam needed at various stages of production. For example factories in the cement industry, have to heat up limestone to 1450°C to turn it into cement, which is done by burning fossil fuels to create the required heat.
Land use changes
Land use changes are a substantial source of carbon dioxide emissions globally, accounting for 9% of human carbon dioxide emissions and contributed 3.3 billion tonnes of carbon dioxide emissions in 2011. Land use changes are when the natural environment is converted into areas for human use like agricultural land or settlements. From 1850 to 2000, land use and land use change released an estimated 396-690 billion tonnes of carbon dioxide to the atmosphere, or about 28-40% of total anthropogenic carbon dioxide emissions.
Deforestation has been responsible for the great majority of these emissions. Deforestation is the permanent removal of standing forests and is the most important type of land use change because its impact on greenhouse gas emissions. Forests in many areas have been cleared for timber or burned for conversion to farms and pastures. When forested land is cleared, large quantities of greenhouse gases are released and this ends up increasing carbon dioxide levels in three different ways.
Trees act as a carbon sink. They remove carbon dioxide from the atmosphere via photosynthesis. When forests are cleared to create farms or pastures, trees are cut down and either burnt or left to rot, which adds carbon dioxide to the atmosphere.
Since deforestation reduces the amount of trees, this also reduces how much carbon dioxide can be removed by the Earth's forests. When deforestation is done to create new agricultural land, the crops that replace the trees also act as a carbon sink, but they are not as effective as forests. When trees are cut for lumber the wood is kept which locks the carbon in it but the carbon sink provided by forests is reduced because of the loss of trees.
Deforestation also causes serious changes in how carbon is stored in the soil. When forested land is cleared, soil disturbance and increased rates of decomposition in converted soils both create carbon dioxide emissions. This also increases soil erosion and nutrient leaching which further reduces the area's ability to act as a carbon sink.
Industrial processes
There are many industrial processes that produce significant amounts of carbon dioxide emissions as a by product of chemical reactions needed in their production process. Industrial processes account for 4% of human carbon dioxide emissions and contributed 1.7 billion tonnes of carbon dioxide emissions in 2011.
Many industrial processes emit carbon dioxide directly through fossil fuel combustion as well indirectly through the use of electricity that is generated using fossil fuels. But there are four main types of industrial process that are a significant source of carbon dioxide emissions: the production and consumption of mineral products such as cement, the production of metals such as iron and steel, as well as the production of chemicals and petrochemical products.
Cement production produces the most amount of carbon dioxide amongst all industrial processes. To create the main ingredient in cement, calcium oxide, limestone is chemically transformed by heating it to very high temperatures. This process produces large quantities of carbon dioxide as a byproduct of the chemical reaction. So much so that making 1000 kg of cement produces nearly 900 kg of carbon dioxide.
Steel production is another industrial process that is an important source of carbon dioxide emissions. To create steel, iron is melted and refined to lower its carbon content. This process uses oxygen to combine with the carbon in iron which creates carbon dioxide. On average, 1.9 tonnes of CO2 are emitted for every tonne of steel produced.
Fossil fuels are used to create chemicals and petrochemical products which leads to carbon dioxide emissions. The industrial production of ammonia and hydrogen most often use natural gas or other fossil fuels as a starting base, creating carbon dioxide in the process. Petrochemical products like plastics, solvents, and lubricants are created using petroleum. These products evaporate, dissolve, or wear out over time releasing even more carbon dioxide during the product's life.
Carbon Dioxide Emissions: Natural Sources
Apart from being created by human activities, carbon dioxide is also released into the atmosphere by natural processes. The Earth's oceans, soil, plants, animals and volcanoes are all natural sources of carbon dioxide emissions.
Human sources of carbon dioxide are much smaller than natural emissions but they upset the balance in the carbon cycle that existed before the Industrial Revolution. The amount of carbon dioxide produced by natural sources is completely offset by natural carbon sinks and has been for thousands of years. Before the influence of humans, carbon dioxide levels were quite steady because of this natural balance.
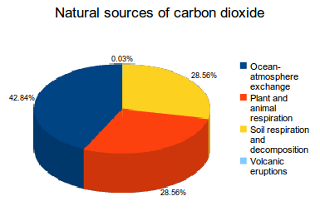
42.84 percent of all naturally produced carbon dioxide emissions come from ocean-atmosphere exchange. Other important natural sources include plant and animal respiration (28.56%) as well as soil respiration and decomposition (28.56%). A minor amount is also created by volcanic eruptions (0.03%).
Figure 3: Source: IPCC Fourth Assessment Report: Climate Change 2007, Intergovernmental Panel on Climate Change.
Ocean-atmosphere exchange
The largest natural source of carbon dioxide emissions is from ocean-atmosphere exchange. This produces 42.84% of natural carbon dioxide emissions. The oceans contain dissolved carbon dioxide, which is released into the air at the sea surface. Annually this process creates about 330 billion tonnes of carbon dioxide emissions.
Many molecules move between the ocean and the atmosphere through the process of diffusion, carbon dioxide is one of them. This movement is in both directions, so the oceans release carbon dioxide but they also absorb it. The effects of this movement can be seen quite easily, when water is left to sit in a glass for long enough, gases will be released and create air bubbles. Carbon dioxide is amongst the gases that are in the air bubbles.
Plant and animal respiration
An important natural source of carbon dioxide is plant and animal respiration, which accounts for 28.56% of natural emissions. Carbon dioxide is a byproduct of the chemical reaction that plants and animals use to produce the energy they need. Annually this process creates about 220 billion tonnes of carbon dioxide emissions.
Plants and animals use respiration to produce energy, which is used to fuel basic activities like movement and growth. The process uses oxygen to break down nutrients like sugars, proteins and fats. This releases energy that can be used by the organism but also creates water and carbon dioxide as byproducts.
Soil respiration and decomposition
Another important natural source of carbon dioxide is soil respiration and decomposition, which accounts for 28.56% of natural emissions. Many organisms that live in the Earth's soil use respiration to produce energy. Amongst them are decomposers who break down dead organic material. Both of these processes releases carbon dioxide as a byproduct. Annually these soil organisms create about 220 billion tonnes of carbon dioxide emissions.
Any respiration that occurs below-ground is considered soil respiration. Plant roots, bacteria, fungi and soil animals use respiration to create the energy they need to survive but this also produces carbon dioxide. Decomposers that work underground breaking down organic matter (like dead trees, leaves and animals) are also included in this. Carbon dioxide is regularly released during decomposition.
Volcanic eruptions
A minor amount carbon dioxide is created by volcanic eruptions, which accounts for 0.03% of natural emissions. Volcanic eruptions release magma, ash, dust and gases from deep below the Earth's surface. One of the gases released is carbon dioxide. Annually this process creates about 0.15 to 0.26 billion tonnes of carbon dioxide emissions.
The most common volcanic gases are water vapor, carbon dioxide, and sulfur dioxide. Volcanic activity will cause magma to absorb these gases, while passing through the Earth's mantle and crust. During eruptions, the gases are then released into the atmosphere.


